Trade the market
with full transparency
Professional crypto orderflow terminal — footprint charts, multi-exchange orderbook, live heatmap, TPO, whale tracking, options flow, and 20+ analytics views. All in your browser. Free.
No account needed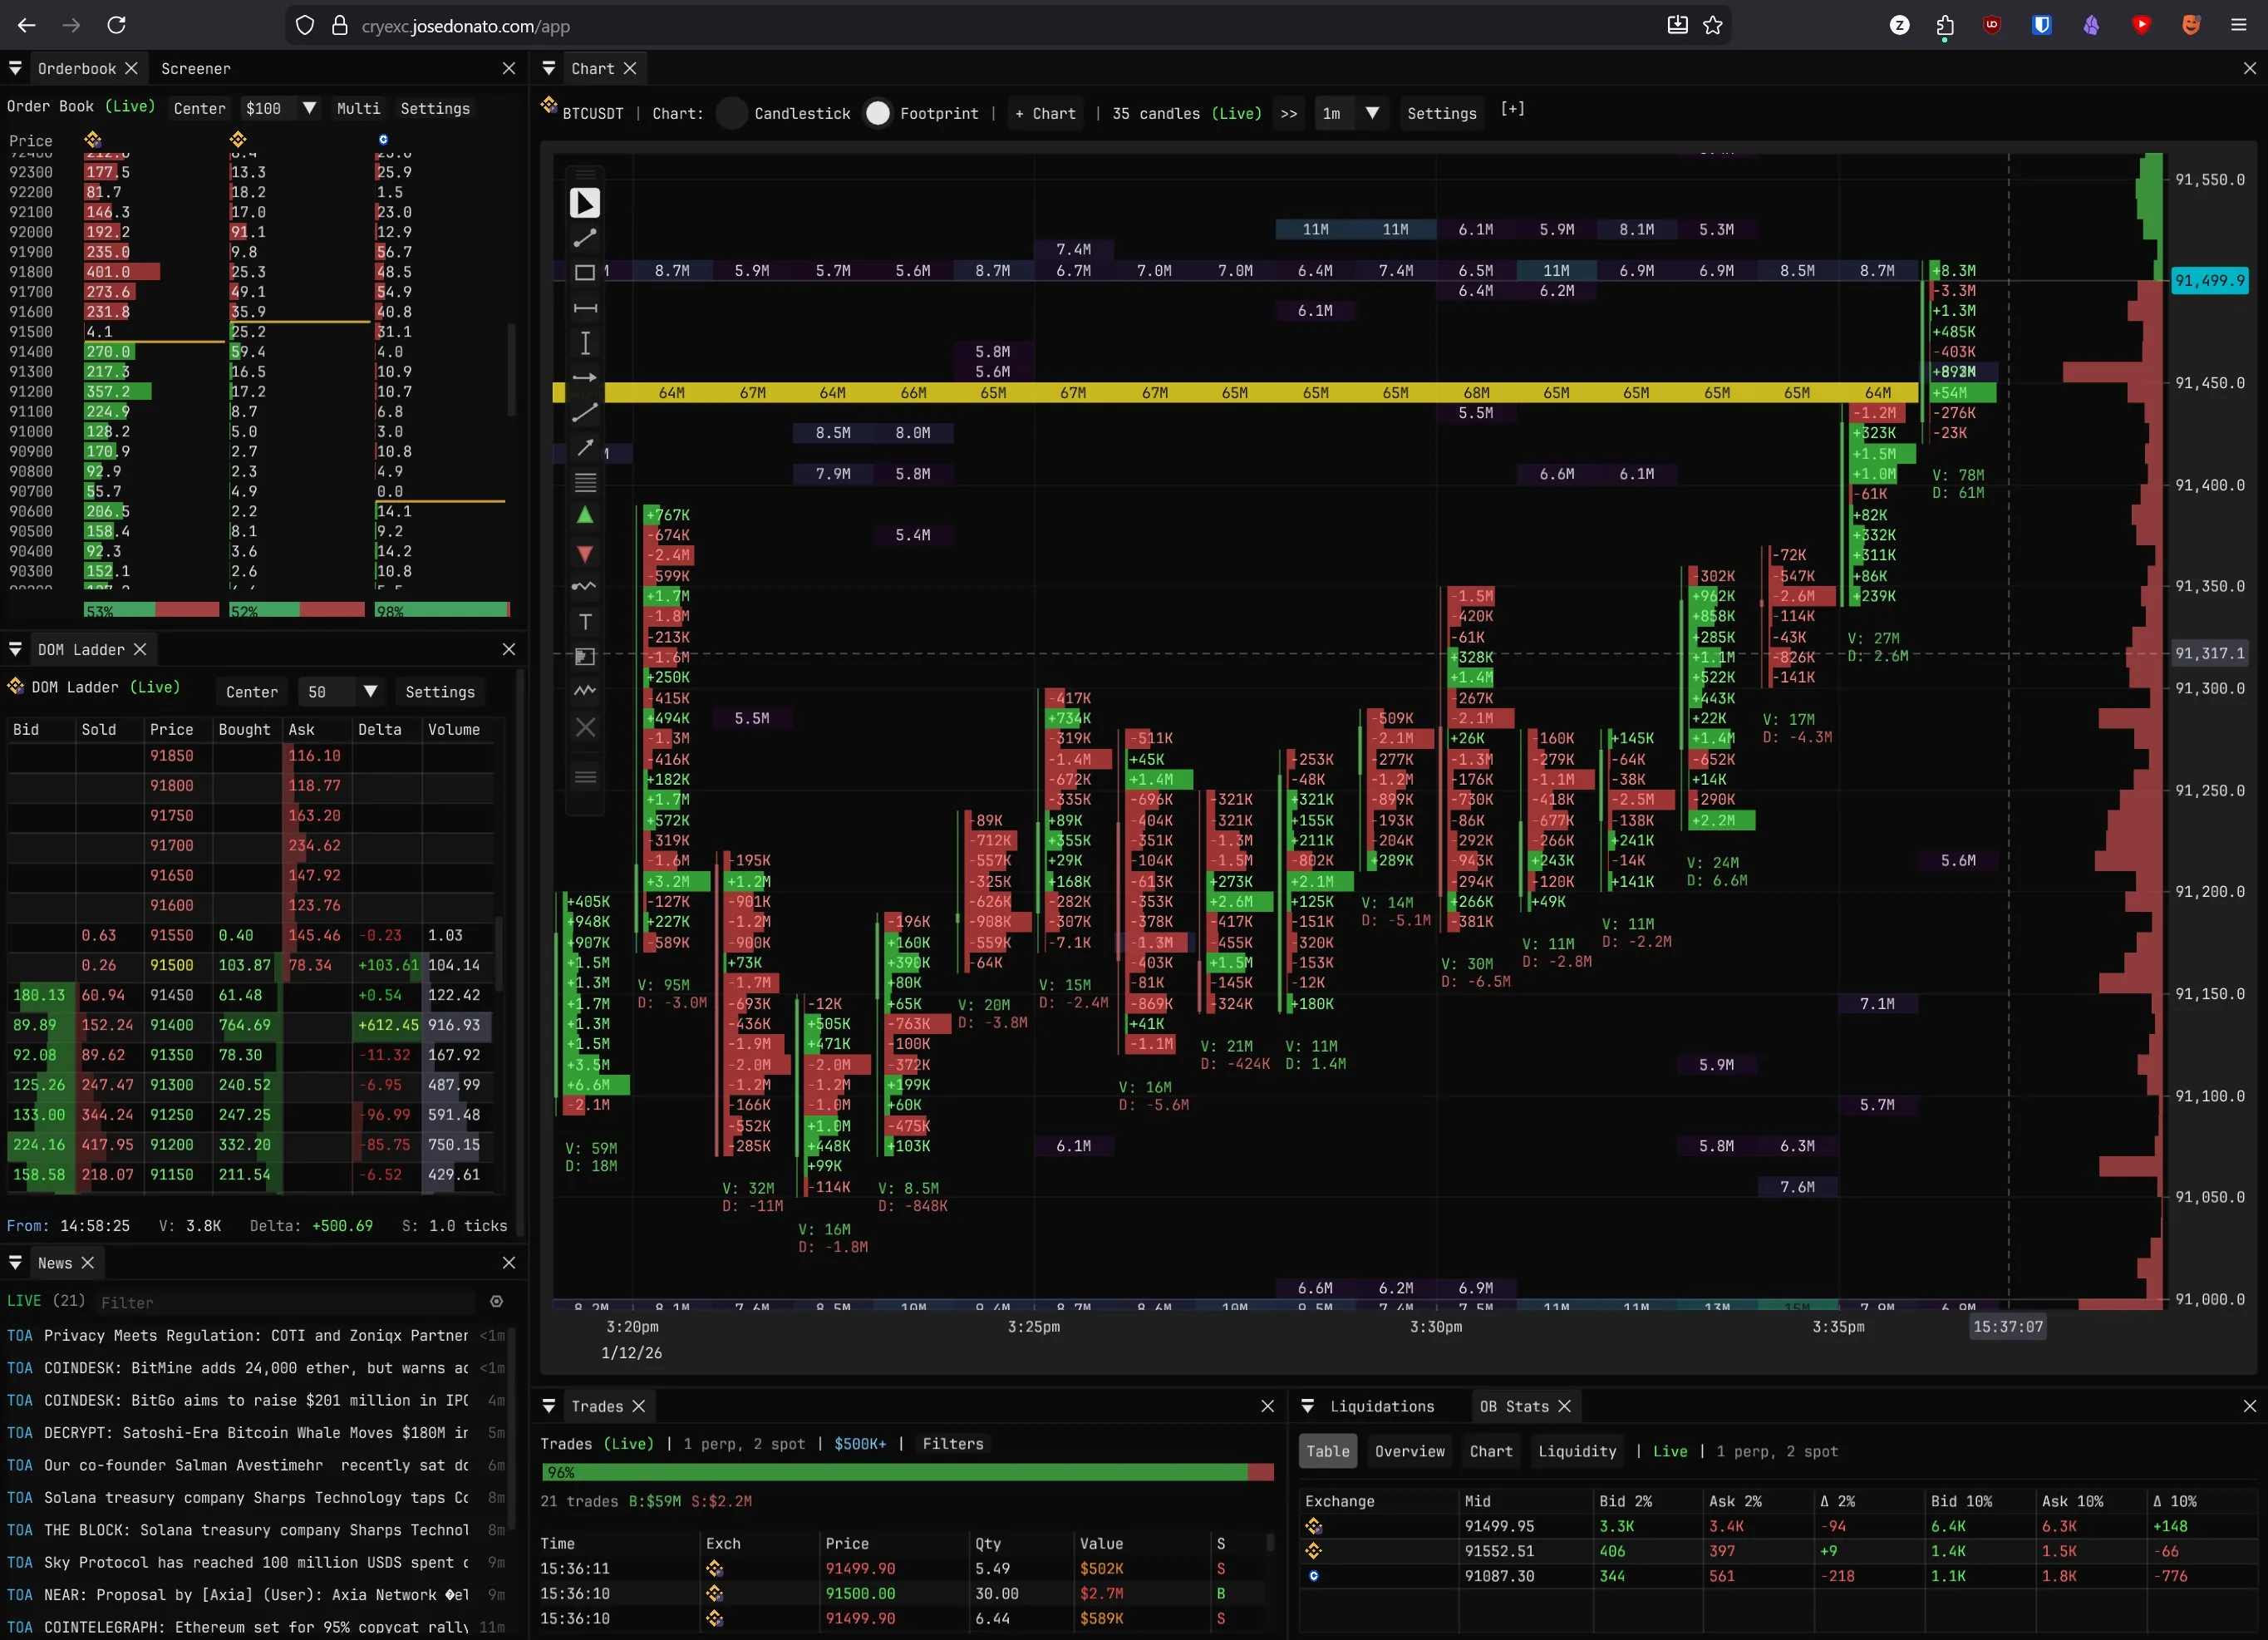
Everything runs in your browser
Direct WebSocket connections to exchanges — no backend, no account, no data leaving your device.
Binance, Hyperliquid, Bybit, OKX, Bitget, Coinbase, Kraken, Bitfinex — live trades, depth, and liquidations via public WebSocket.
C++ compiled to WebAssembly processes everything locally. Near-native performance, zero latency to a server, full privacy.
Footprint, heatmap, orderbook, TPO, liquidations, whale tracking, and 20+ more views — fully customizable layout.
Everything serious traders use
Purpose-built for orderflow, structure, and quantitative analysis across multiple exchanges.
Real-time order-by-order market intelligence.
Footprint charts
Bid/ask volume per price level. Multi-exchange aggregation with CVD subplots by trade-size bucket.
Live heatmap
Real-time depth tape with spoof and iceberg detection, velocity coloring, and trade clustering.
Orderbook heatmap
Historical depth-of-market heatmap overlaid on the footprint chart. Spot walls and spoofing patterns.
Multi-source orderbook
Aggregated depth across Binance Spot + Futures, Hyperliquid, Bybit, OKX, and more.
DOM / Ladder
Depth-of-market ladder with bid, ask, sold, bought, delta, and volume columns.
Tape feed
Time-and-sales with size filtering. Every print that moves the market.
Context that separates noise from signal.
Market profile / TPO
Time-Price Opportunity charts with value areas, POC, single prints, and session analysis.
Volume profile
Historical volume-at-price with POC, VAH/VAL, HVN/LVN detection, and extension lines.
Historical charts + bar replay
Full candlestick history with indicators, Heikin-Ashi, and step-through replay mode.
Liquidation heatmap
Estimated liquidation cascade levels. See where leveraged positions are stacked.
Market correlation
Real-time BTC vs NQ, SPY, Gold, Oil, Silver comparison. Macro context in the same view.
Funding rate arbitrage
Cross-exchange funding rate comparison with annualized rates and open interest.
Quantitative signals on top of raw data.
Screener & VWAP screener
Bubble scatter chart of all symbols by VWAP deviation vs price distance, colored by funding rate.
RSI heatmap
All-symbol RSI bubble chart with overbought/oversold zone bands.
Hyperliquid whale tracking
Top open positions, wallet watchlist, and trader cohort analysis by size.
Options widget
Deribit vol surface, GEX profile, options chain, strike/expiry heatmap, and put/call ratios.
Alerts
9 alert types: price, volume, delta, liquidation, CVD divergence, exhaustion, and more.
Track performance. Stay informed.
Polymarket
Live prediction market prices with history charts alongside crypto data.
Trade journal
Log and tag trades with playbook tab. Review your edge over time.
Calendar returns
Daily, weekly, monthly, and hourly P&L heatmap. Visualize your performance distribution.
Historical / live performance
Normalized multi-symbol return comparison across custom timeframes.
Economic calendar
Macro event schedule with impact ratings. Know what's coming before it hits.
News feed
Multi-source crypto news stream integrated into the terminal.
Free tools, no terminal required
Each one is its own page. No account, nothing to install, and they link back to the terminal when you want the full view.
Browse all toolsFAQ
Common questions about Cryexc.
No. This is a personal project I build in my free time for my own trading. There's no paid plan.
100% free, no account needed.
Launch appEverything runs on your device, connecting directly to exchange public feeds — there is no server rendering charts for you. The one hosted piece is the optional Full history source, and it is off by default. I build this in my spare time — if you find it useful and want to support future development, click the Support me button in the app's bottom bar for crypto donation addresses.
Open the appYes. Settings → History → Source picks what sits behind the live bars — a short BTC prefix under the default Live exchange, or the last 48 hours of real footprint history on any covered symbol under Full history (see the next question). The Historical Chart panel is separate and draws plain candles at any interval and lookback. History is fetched fresh each session; what persists in your browser is settings, layouts and journal entries.
How history sources workLive exchange is the default: every venue connects straight to its own websocket, BTC loads a short history prefix, and every other symbol builds forward from the moment you connect with dimmed kline bars behind it for context. Full history (alpha) instead streams the last 48 hours of real footprint history — per-price bid and ask volume, not just OHLC — behind the live bars for every covered symbol, sourced from TapeSurf. The window ends at 48 hours; scroll back to the edge and the chart shows a 48h limit chip. Archive bars carry volume, delta and levels, but not per-trade detail, so trade-size tiers (small/mid/whale) and trade counts stay empty on them and fill in on bars your session watched live.
How history sources workNo. The bottom-left selector loads a live instrument catalog from every connected venue — 20+ spot and perp exchanges — sorted by 24h volume, so it is the venues' own listings rather than a hardcoded shortlist. You can also merge several venues into one aggregated chart, and Hyperliquid's HIP-3 builder markets add TradFi pairs like crude oil and index products. If Binance is geo-blocked where you are, the other venues still work.
How venues and aggregation workNo direct CME feeds—cost prohibitive for a free tool. However, there's a correlation chart showing real-time NQ, SPY, Gold, and Oil prices vs BTC. Hyperliquid's HIP-3 pairs are also supported, which include TradFi symbols like Crude Oil, SP500, XYZ100, and more—on-chain exposure to commodities and macro assets.
See market correlation demoBrowser only — built with ImGui + C++ compiled to WebAssembly for near-native performance. /app is an installable PWA, so it can run in its own window from your dock or home screen. Mobile UX improvements are planned.
Got an idea or feature request? Reach out—I consider features based on availability.
Contact on XNo accounts, no sign-ups, no analytics scripts, no tracking pixels. Settings, layouts and journal entries live in your browser's localStorage and IndexedDB and never leave the device, and the exchange feeds connect straight from your browser. One exception worth naming: if you switch history to Full history, those requests go through a hosted proxy, which records the market and response size plus a salted hash of the IP — enough to count how many people use the alpha, useless as an identifier.
Privacy policyThe build ships WebAssembly SIMD, so it needs Chrome/Edge 91+, Firefox 89+ or Safari 16.4+, plus WebGL. Desktop is the primary target; mobile works and keeps improving.